
The Setup
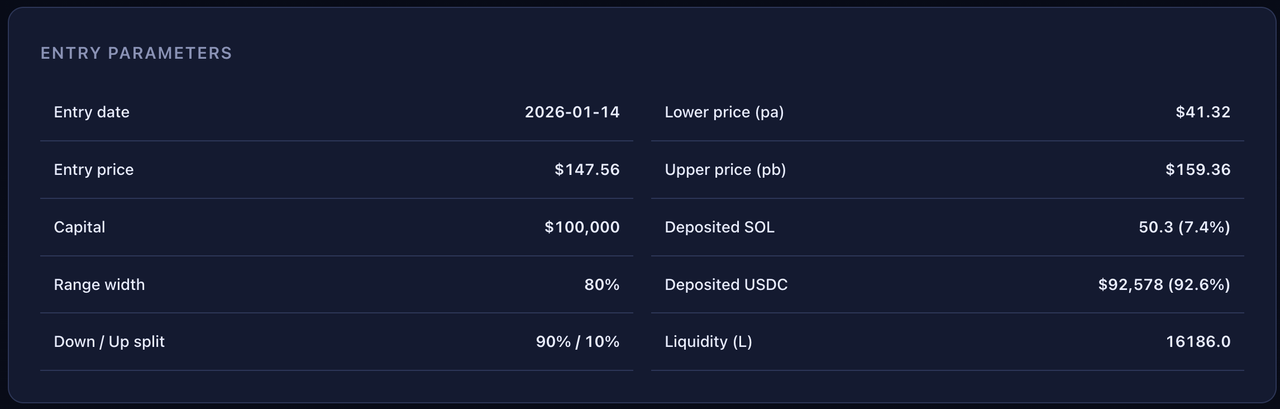
You deploy $100,000 into an Orca SOL/USDC concentrated liquidity pool right at the 2026 top. You pick a wide 80% range, skewed heavily downward - 90% of the range sits below spot, 10% above. The goal: survive volatility.
Here is what that looks like in V3 math.
The Crash
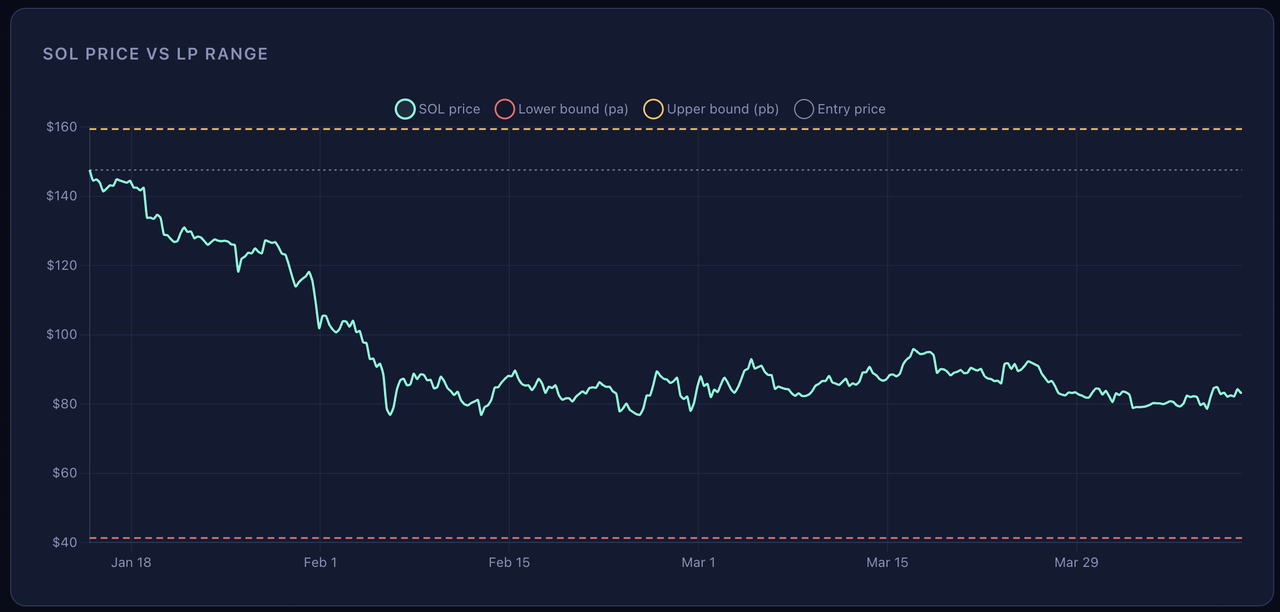
From 2026-01-14 to 2026-04-10 - 85.4 days of real Kraken SOL/USD hourly data. Spot bled -43.51%. Here is price vs your LP range:
LP vs HODL: The Equity Curves
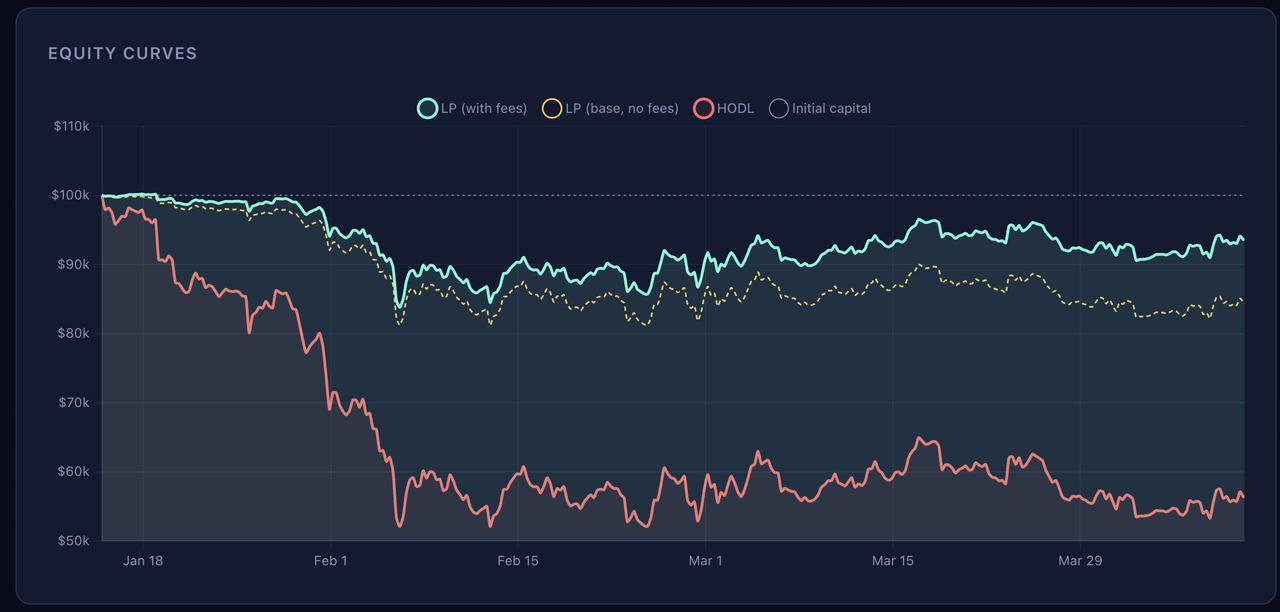
Start both strategies with $100,000. One buys SOL at the top and holds. The other deploys into the CL range. Fees for the LP are accrued at ~0.12% per day on current notional which is the midpoint of 0.10-0.13% assumption. (average yield during these conditions)
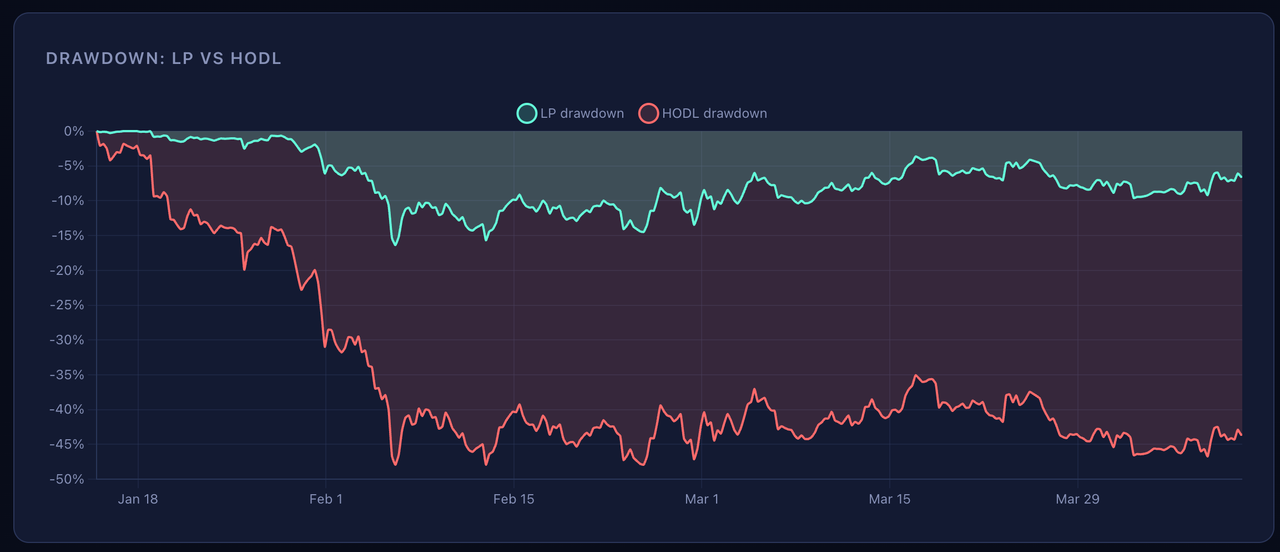
The headline number
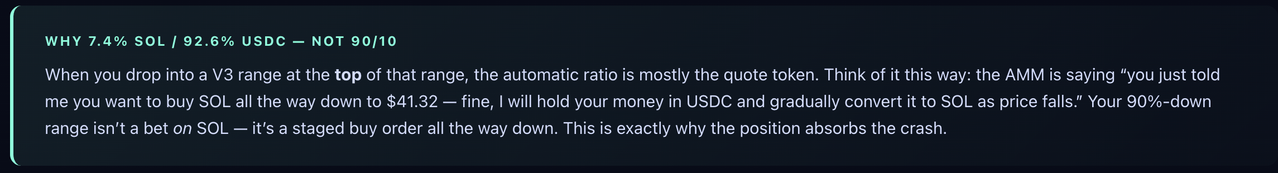
Outperformance vs HODL: +37.19 percentage points. You accrued $9,042 in fees over 85.4 days, but the bulk of the alpha didn’t come from fees. It came from the LP curve itself being concave: your position sheds SOL exposure on the way up and accumulates SOL on the way down.
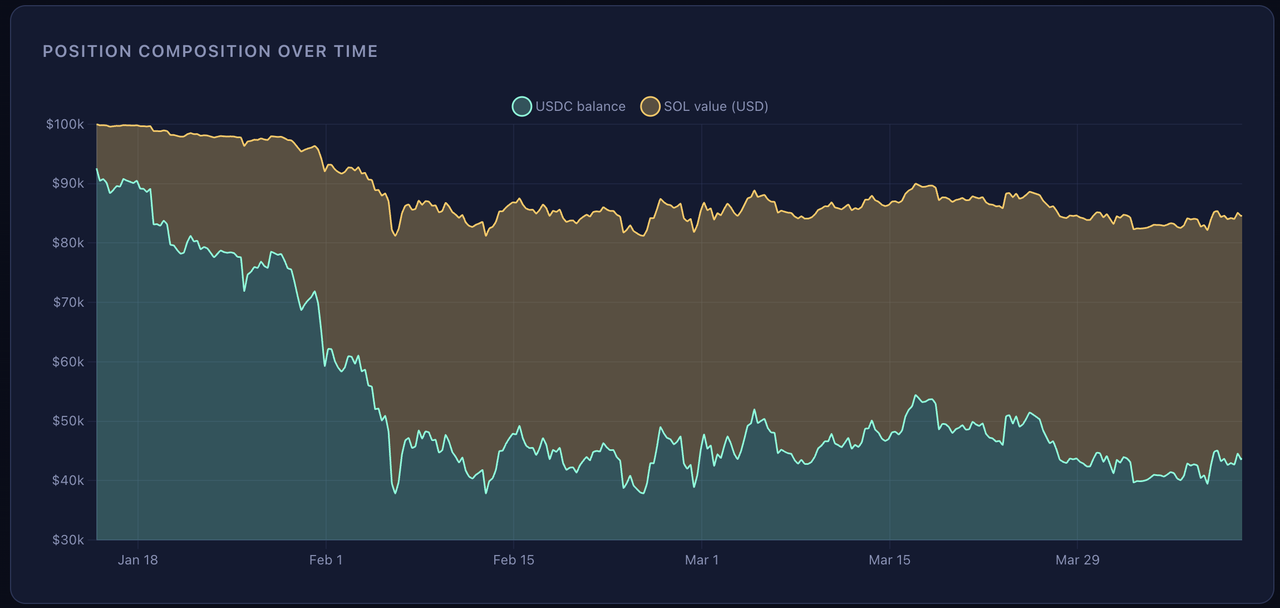
Why It Worked: The Auto-DCA Mechanism
The real magic: watch how your SOL holdings grow as the price falls. You entered with 50.3 SOL. You are ending with 490.75 SOL. The range converted USDC into SOL automatically, at progressively better prices.
What This Actually Teaches
1. Wide ranges are insurance, not waste
The usual “optimize for capital efficiency” advice says use tight ranges to collect more fees per dollar. This case is the counter-argument: an 80% range collected less fee-per-dollar than a 5% range would have, but it never got kicked out, never needed a rebalance, and it absorbed a 43% spot crash into a 6% drawdown. Fee yield you never get to collect (because you got range-exited) is zero.
2. The real alpha was IL being negative vs HODL
Impermanent loss is usually framed as a tax. In a one-sided crash from the top of a wide range, the “IL” vs HODL works in your favor: you sold high (shed SOL into USDC as you went through time) and bought low (USDC got converted to SOL at progressively cheaper prices). The final LP position has 490.75 SOL + $43,731 USDC - way more SOL than the HODLer, because the HODLer never bought more.
3. Entry placement matters more than range width
Entering at the top of a down-biased range is the bullish version of a staged buy. If you had entered the same 80% range at the bottom instead, the same math would hurt you: you’d enter mostly in SOL and bleed if price kept falling. The asymmetry in this case came from where you dropped the range relative to spot, not the width itself.